FAQ - Precipitation and CoCoRaHS
Precipitation is crucial for agricultural production, especially in non irrigated crops and rangelands. Because precipitation is highly variable from year to year it is important to observe, record, and understand methods of gathering precipitation.
Precipitation FAQs:
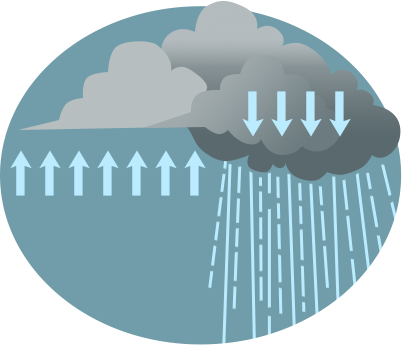
What causes precipitation to fall?
Water droplets or ice particles in clouds grow and combine; they continue to grow to the point where the updrafts (an upward current of air) in the clouds can no longer support them, thus causing precipitation.
- To learn more, please visit: NASA: Global Precipitation Measurement
What causes variability in precipitation?
There are several water cycle variables: evaporation, condensation, precipitation, groundwater flow, ice accumulation, and runoff. In addition, the spatial and temporal scales of rainfall in locations play a very important role in rainfall variability. The interactions of these components with Earth’s energy cycle is responsible for natural climate variability, including precipitation.
Much of the variability depends on the source or sources of water vapor. For example, proximity to large bodies of water provides a constant source year-around. Proximity to significant land features such as mountain ranges can play an important role. In general the higher elevations receive more precipitation annually than the lower elevations. Even the aspect of the mountain makes a difference. On many occasions, on one side of the mountain it may be raining but the other side, dry.
Finally time of year is an important factor. For the Desert Southwest, nearly half the annual rainfall comes during the monsoon season and sometimes nearly half of that can come in one thunderstorm. Due to the nature of cloud development in the summer, rain can be highly variable on a day to day basis and from place to place. Folks sometimes say “it’s raining on the front porch but not in the back.” In the east coast and Gulf states, hurricane season occurs in the summer to early fall. Even in the Desert Southwest we can be influenced by tropical weather. Remnants of a tropical storm may linger and be carried inland and can dump large amounts of rain over several days.
- To learn more, please visit: NASA: Water Cycle
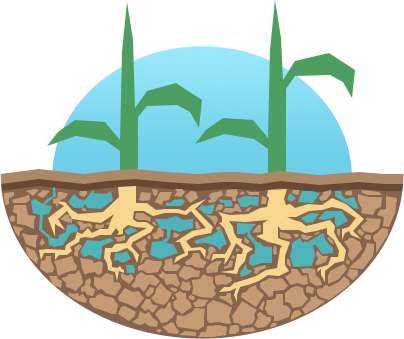
How can we increase resilience through improved soil and nutrient management?
First, we need to know that soil is a living system. Healthy soil is like a healthy human being; it can function better when health and nutrition are balanced. Improved management practices that minimize disturbance, increase diversity in crop residue and nutrient inputs, and provide a consistent environment for microbial proliferation can accumulate more soil organic matter, which is a storehouse of nutrients. Soil organic matter also increases water holding capacity, pH buffering, soil aggregation and aggregate stability, and infiltration. With these positive changes, soils can function better under biotic (insect pests and diseases) and abiotic (heat and drought) stresses.
How does hail form?
Hail forms from an occurrence of thunderstorm updrafts carrying water droplets above the freezing level. As the water droplets freeze, a hailstone begins to form and increases in size as more water freezes onto it. Strong updrafts carry the hail up and down and several times. Eventually, the hailstone is too heavy to be supported by the updraft and falls to the ground.
Next time you see large hail look for rings of ice. Multiple rings indicated that it travelled up and down several times before falling to the ground.
- To learn more, please visit: NASA: Global Precipitation Measurement
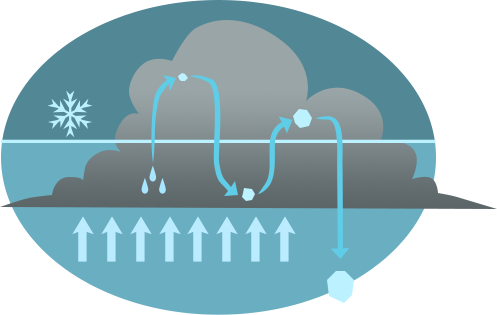
What is sublimation?
Sublimation is the conversion of a solid to the gaseous phase with no intermediate liquid phase. Sublimation describes the process of snow and ice changing into water vapor. A good example to understand and visualize sublimation is dry ice. Dry ice is solid, frozen carbon dioxide that sublimates or turns to gas.
- For more information, please visit: USGS: Sublimation and the Water Cycle
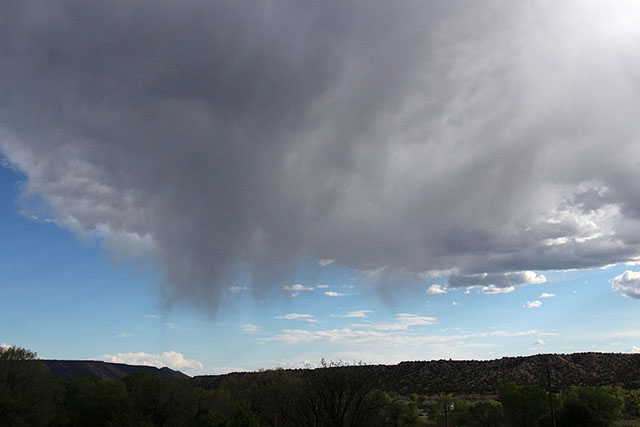
In regions of extreme temperatures and dry air, rain can evaporate shortly after being released from clouds and never fully make it to the ground. This can look like wisps of rain trailing from clouds. This phenomena is known as virga, Latin for “twig” or “branch”. This could refer to the wisps of rain branching off from the cloud.
- For more information, please visit: What Is Virga Precipitation?
What on-line resources exist for viewing data associated with precipitation and snow:
SNOTEL or Snow Telemetry is an automated snow monitoring network operated by the USDA NRCS that is composed of over 800 data collection sites. SNOTEL monitors snowpack, snow depth, precipitation, and other climate conditions. Most of the SNOTEL stations are at high elevation locations.
- For more information, please visit: NRCS: Snow Telemetry (SNOTEL) and Snow Course Data and Products
PRISM is the abbreviation for Parameter-elevation Regressions on Independent Slopes Model “PRISM Climate Group gathers climate observations from a wide range of monitor networks, applies sophisticated quality control measures, and develops spatial climate datasets to reveal short- and long-term climate patterns.” The dataset covers a period from 1895 to the present and incorporates a variety of modeling techniques that are available at multiple spatial and temporal resolutions. Did you know that PRISM uses CoCoRaHS observations in its calculations of precipitation among other networks?
- For more information, please visit: Oregon State University: PRISM Climate Data
CoCoRaHS FAQs:
What is CoCoRaHS?
CoCoRaHS stands for Community Collaborative Rain, Hail, and Snow Network. It is a community-based network operating across all fifty states with volunteers of all ages and backgrounds working together to measure and map precipitation. CoCoRaHS aims to provide the highest quality data for natural resource, education, research and numerous other applications. Everyone can participate in data collection and recording after they’ve signed up and taken the training.
- Learn more at Community Collaborative Rain, Hail and Snow Network
- To view CoCoRaHS data, please visit: CoCoRaHS View Data
- View maps/data for our study region and surrounding counties
How can I sign up?
- To participate in CoCoRaHS and become a volunteer observer, please visit Become a CoCoRaHS Observer
How is rain measured?
Rain is measured using a 4-inch diameter rain gauge. The rain gauge is composed of three parts: a funnel, a measuring tube, an overflow tube, and a mounting bracket. The funnel directs the precipitation into the measuring tube and magnifies it by a factor of 10. This allows observers to report rainfall to the nearest 0.01" (one-hundredth of an inch). The measuring tube, when full, will hold "one inch" of rainfall. When it rains more than one inch, the excess water collects in the overflow tube.
- For information on how to read the rain gauge, please visit: How to read your rain gauge
If I am an agricultural producer, why might I want to monitor precipitation in my place?
Due to high spatial variability in weather, the timing and amount of precipitation can impact the type and amount of production you will find on your land. Informing yourself about localized precipitation events allows you to adapt management strategies for drought.
How is hail measured in CoCoRaHS?
Hail is sometimes measured using styrofoam boards wrapped in foil, called hail pads. While the official method uses these pads, you can measure them on any surface. In New Mexico we don’t use hail pads but encourage our observers to let us know when we do get hail. The important things are to measure the size, quantity, time of the hail, and the duration. Stay safe during the hail storm but we also collect information such as changes in stone size, hardness, and sudden changes in the number of stones reaching the ground.
- For more information, please visit: Things to know about hail
How is snow measured in CoCoRaHS?
Snow is measured in two ways: (1) a snowboard and ruler used to measure snowfall accumulation, and (2) a 4-inch diameter gauge used to measure the liquid-equivalent of snowfall (after the snow has melted).
- For information, please visit: Guide to Measuring Snow
How do I use the CoCoRaHS website to report data? Visit cocorahs.org and log into your account using the username and password you created when you joined. Click on “My Data” on the top of the page. There will be a shortlist of links under the Menu, “Enter My New Reports.” Click on “Daily Precipitation” to go to the Daily Precipitation Report Form. This form will allow you to report on the amount of rain, snow, hail, duration information. Click on “Multi-Day Accumulation” to go to the Multiple Day Accumulation Form. This form allows you to report what you observe if you have been away for multiple days and have been unable to report data during that time.
- For more on how to report data, please visit: How do I use the CoCoRaHS website to report data? (PDF)
How do I use the CoCoRaHS app to report data?
The CoCoRaHS app is available for both android and iOS. Once you have downloaded the app onto your smart device, you log in using the username and password you created when you first joined. You are then taken to the mobile data entry form which allows you to report the date, time, and amount of precipitation. In order to add notes and snow data for iOS, tap on “Details” in the top corner. For android devices, tap on “Click To Specify Snow & Flooding Info” to enter snow data and tap on “optional notes” to enter notes about your entries.
- To learn more, please visit: How do I use the CoCoRaHS app to report data? (PDF)
How is CoCoRaHS data used to inform the drought monitor?
Data reported to CoCoRaHS helps the U.S. Drought Monitor determine where drought is occurring. When observers report zeros, it helps the U.S. Drought Monitor interpret how a county’s agricultural interests may be affected by drought.
- To learn more, please visit: Uses of CoCoRaHS Data
What variables, other than precipitation, are used by the drought monitor?
In addition to precipitation, experts use variables such as temperature, soil moisture, snow cover, vegetation, evapotranspiration, reservoir storage levels, and meltwater runoff. They use numerous indicators, including reports of water shortages and business interruptions, to determine regional drought conditions. Once local experts verify actual conditions on the ground, the weekly drought map is published.
- To learn more, please visit: Weekly Drought Map
Contact:
Dave DuBois
New Mexico State Climatologist
Department of Plant & Environmental Sciences
New Mexico State University
P.O. Box 30003 MSC 3Q
Las Cruces NM 88003
575-646-2974
Email: dwdubois@nmsu.edu